What the Orders section shows
The Orders section gives you a complete view of every order your store has received, split into two views:Orders List
A searchable, filterable table of every order — click any row to see the full order detail
Order Reports
Aggregated analytics and charts — trends, distributions, and breakdowns
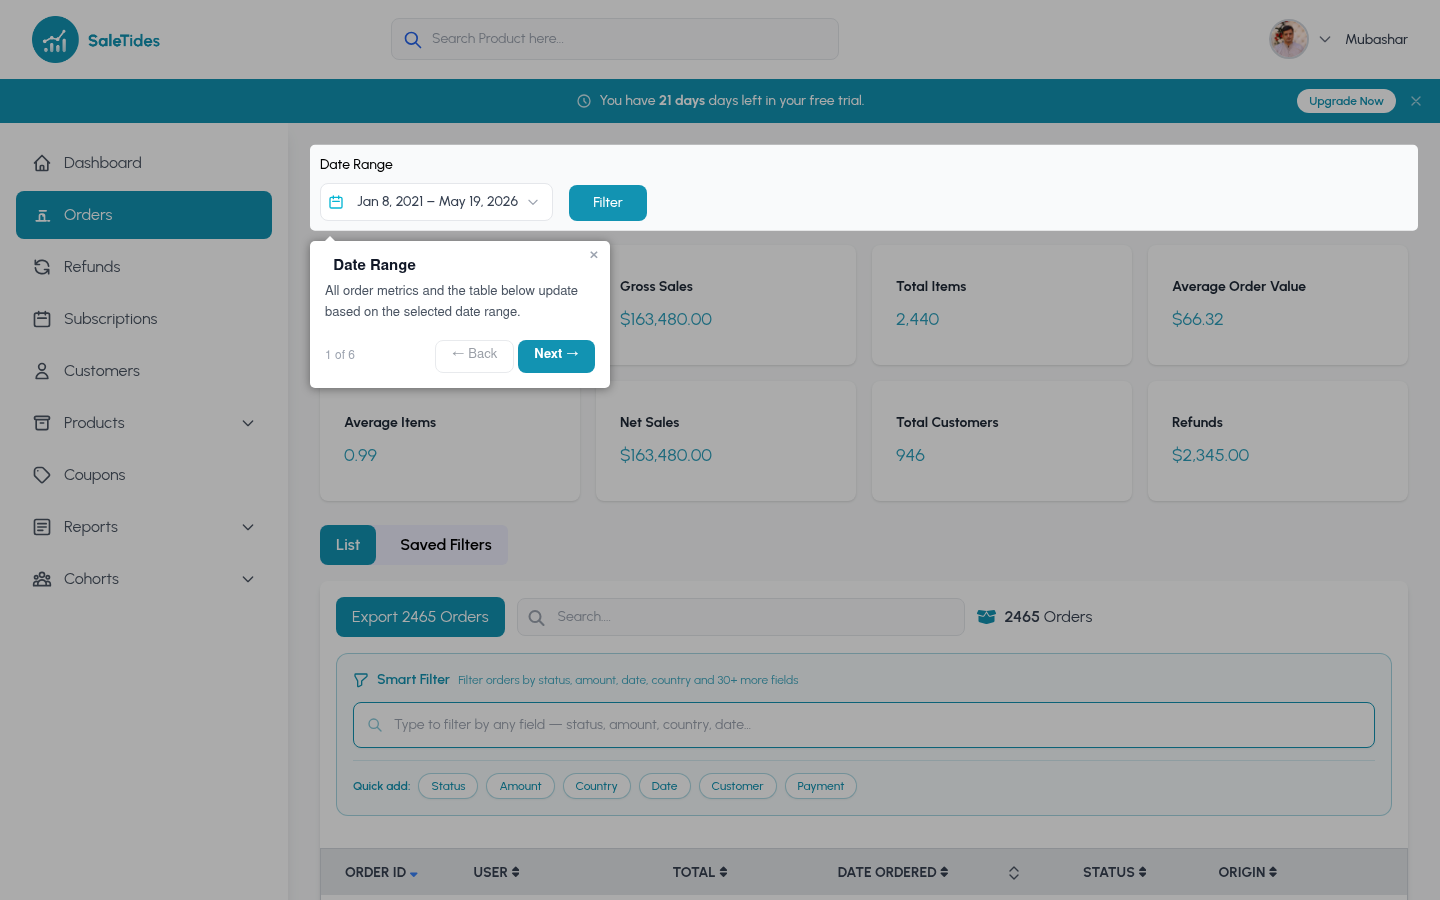
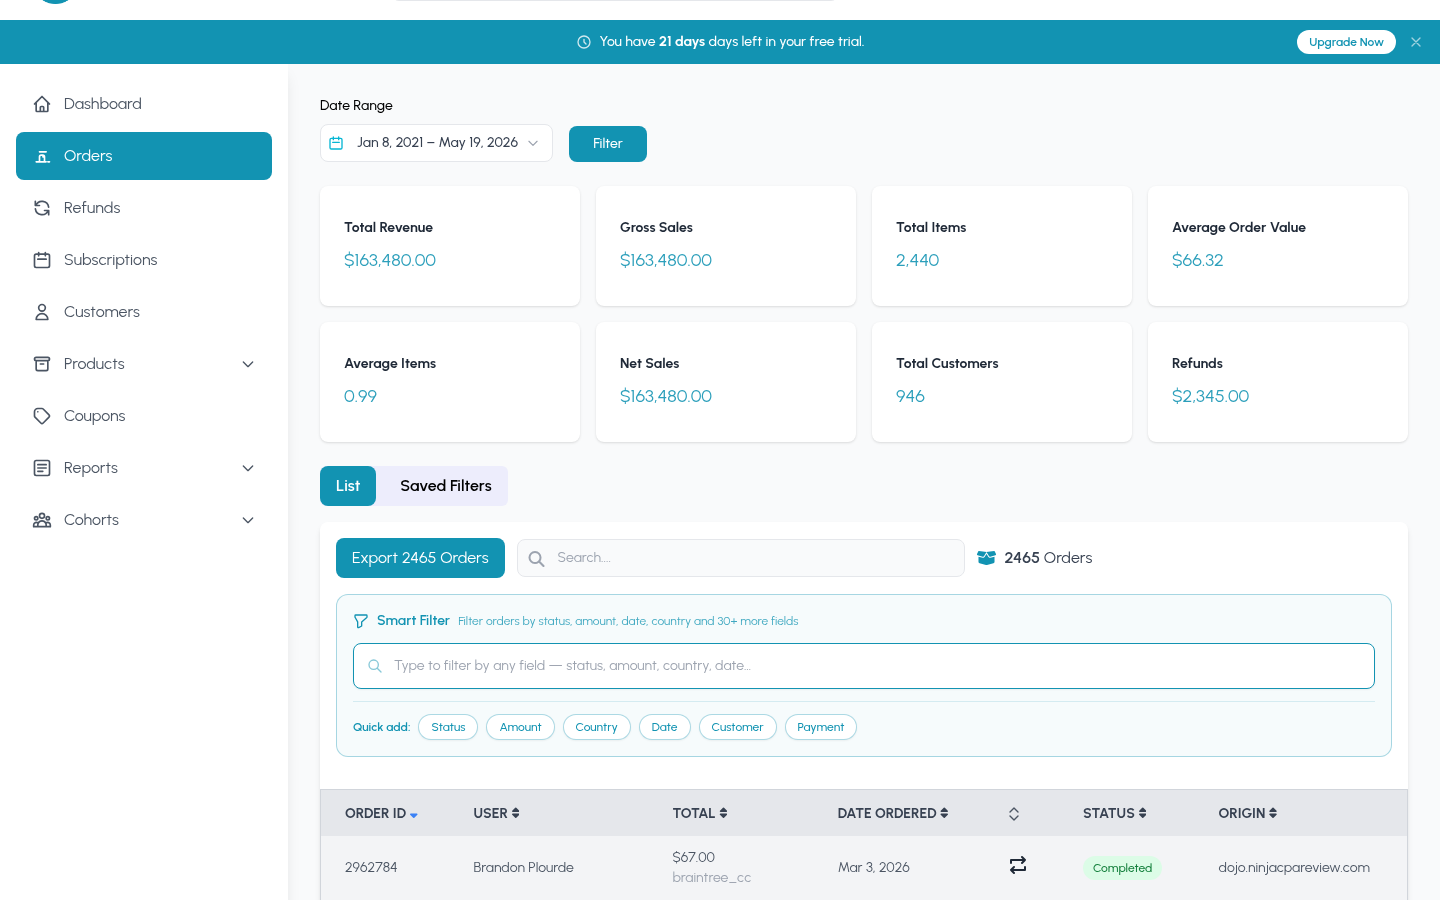
Key metrics
These four metrics appear at the top of every orders view:| Metric | What it measures |
|---|---|
| Total Orders | Number of orders in the selected date range |
| Total Revenue | Gross revenue before refunds |
| Average Order Value | Revenue ÷ order count |
| Repeat Rate | % of orders from customers who ordered before |
Orders list

Searching
Use the search bar to find orders by order number, customer name, or email address.Filtering
- By status
- By attribute
- By segment
Filter to specific WooCommerce order statuses:
- Completed — paid and fulfilled
- Processing — paid, awaiting fulfillment
- On Hold — awaiting payment confirmation
- Pending — awaiting payment
- Cancelled — cancelled before fulfillment
- Refunded — fully refunded
- Failed — failed payment
Order detail page
Click any order to see:- Line items with product names, quantities, and prices
- Billing and shipping addresses
- Payment method and transaction details
- Order notes and metadata
- Linked refunds
Order charts
Navigate to Orders → Charts for visual breakdowns:Revenue & orders over time
Revenue & orders over time
Line or bar charts showing gross revenue and order volume by day, week, or month. Toggle granularity using the controls above the chart.
Orders by day of week & hour
Orders by day of week & hour
Which days and hours see the most orders? Use this to time promotions and plan staffing.
New vs. returning customers
New vs. returning customers
The split between first-time buyers and repeat customers over time. A growing returning customer share indicates healthy retention.
Order value distribution
Order value distribution
A histogram showing how orders are spread across price ranges — where does most of your volume sit?
Items per order distribution
Items per order distribution
How many line items are typically in an order? Are customers buying single items or filling their cart?