

Subscription retention
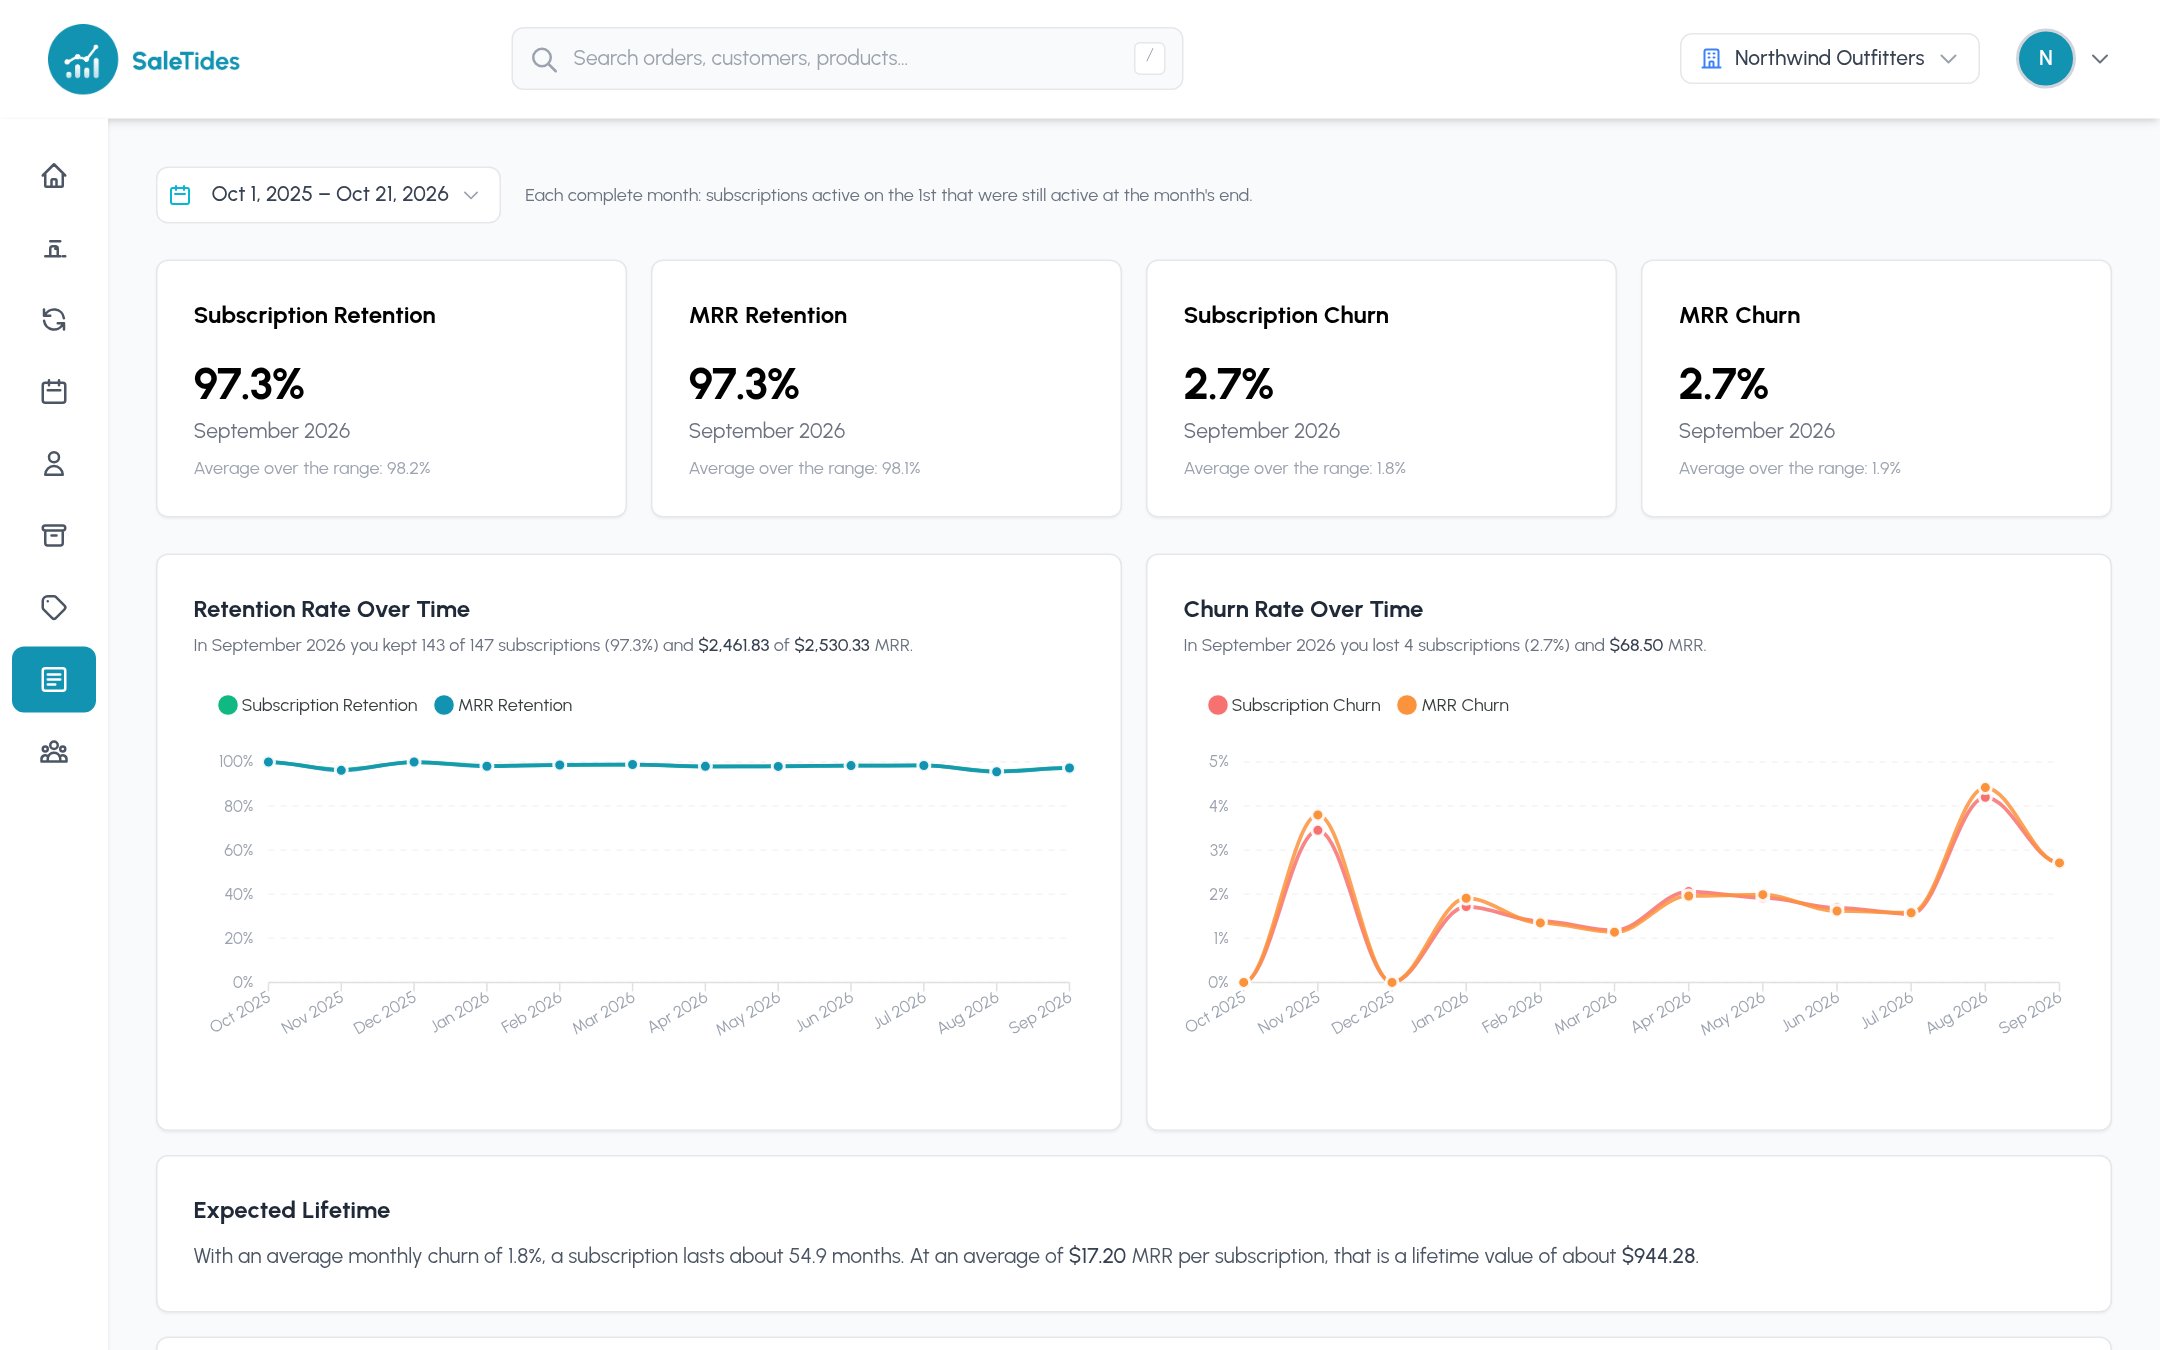
Cards average the months in your range. Charts show retention and churn month by month, the Monthly Breakdown table gives each month’s figures, and Expected Lifetime turns your average churn into how long a subscription lasts and what it’s worth over that time.
Only complete months count. Pick a range that includes at least one full month.
Subscription cohorts
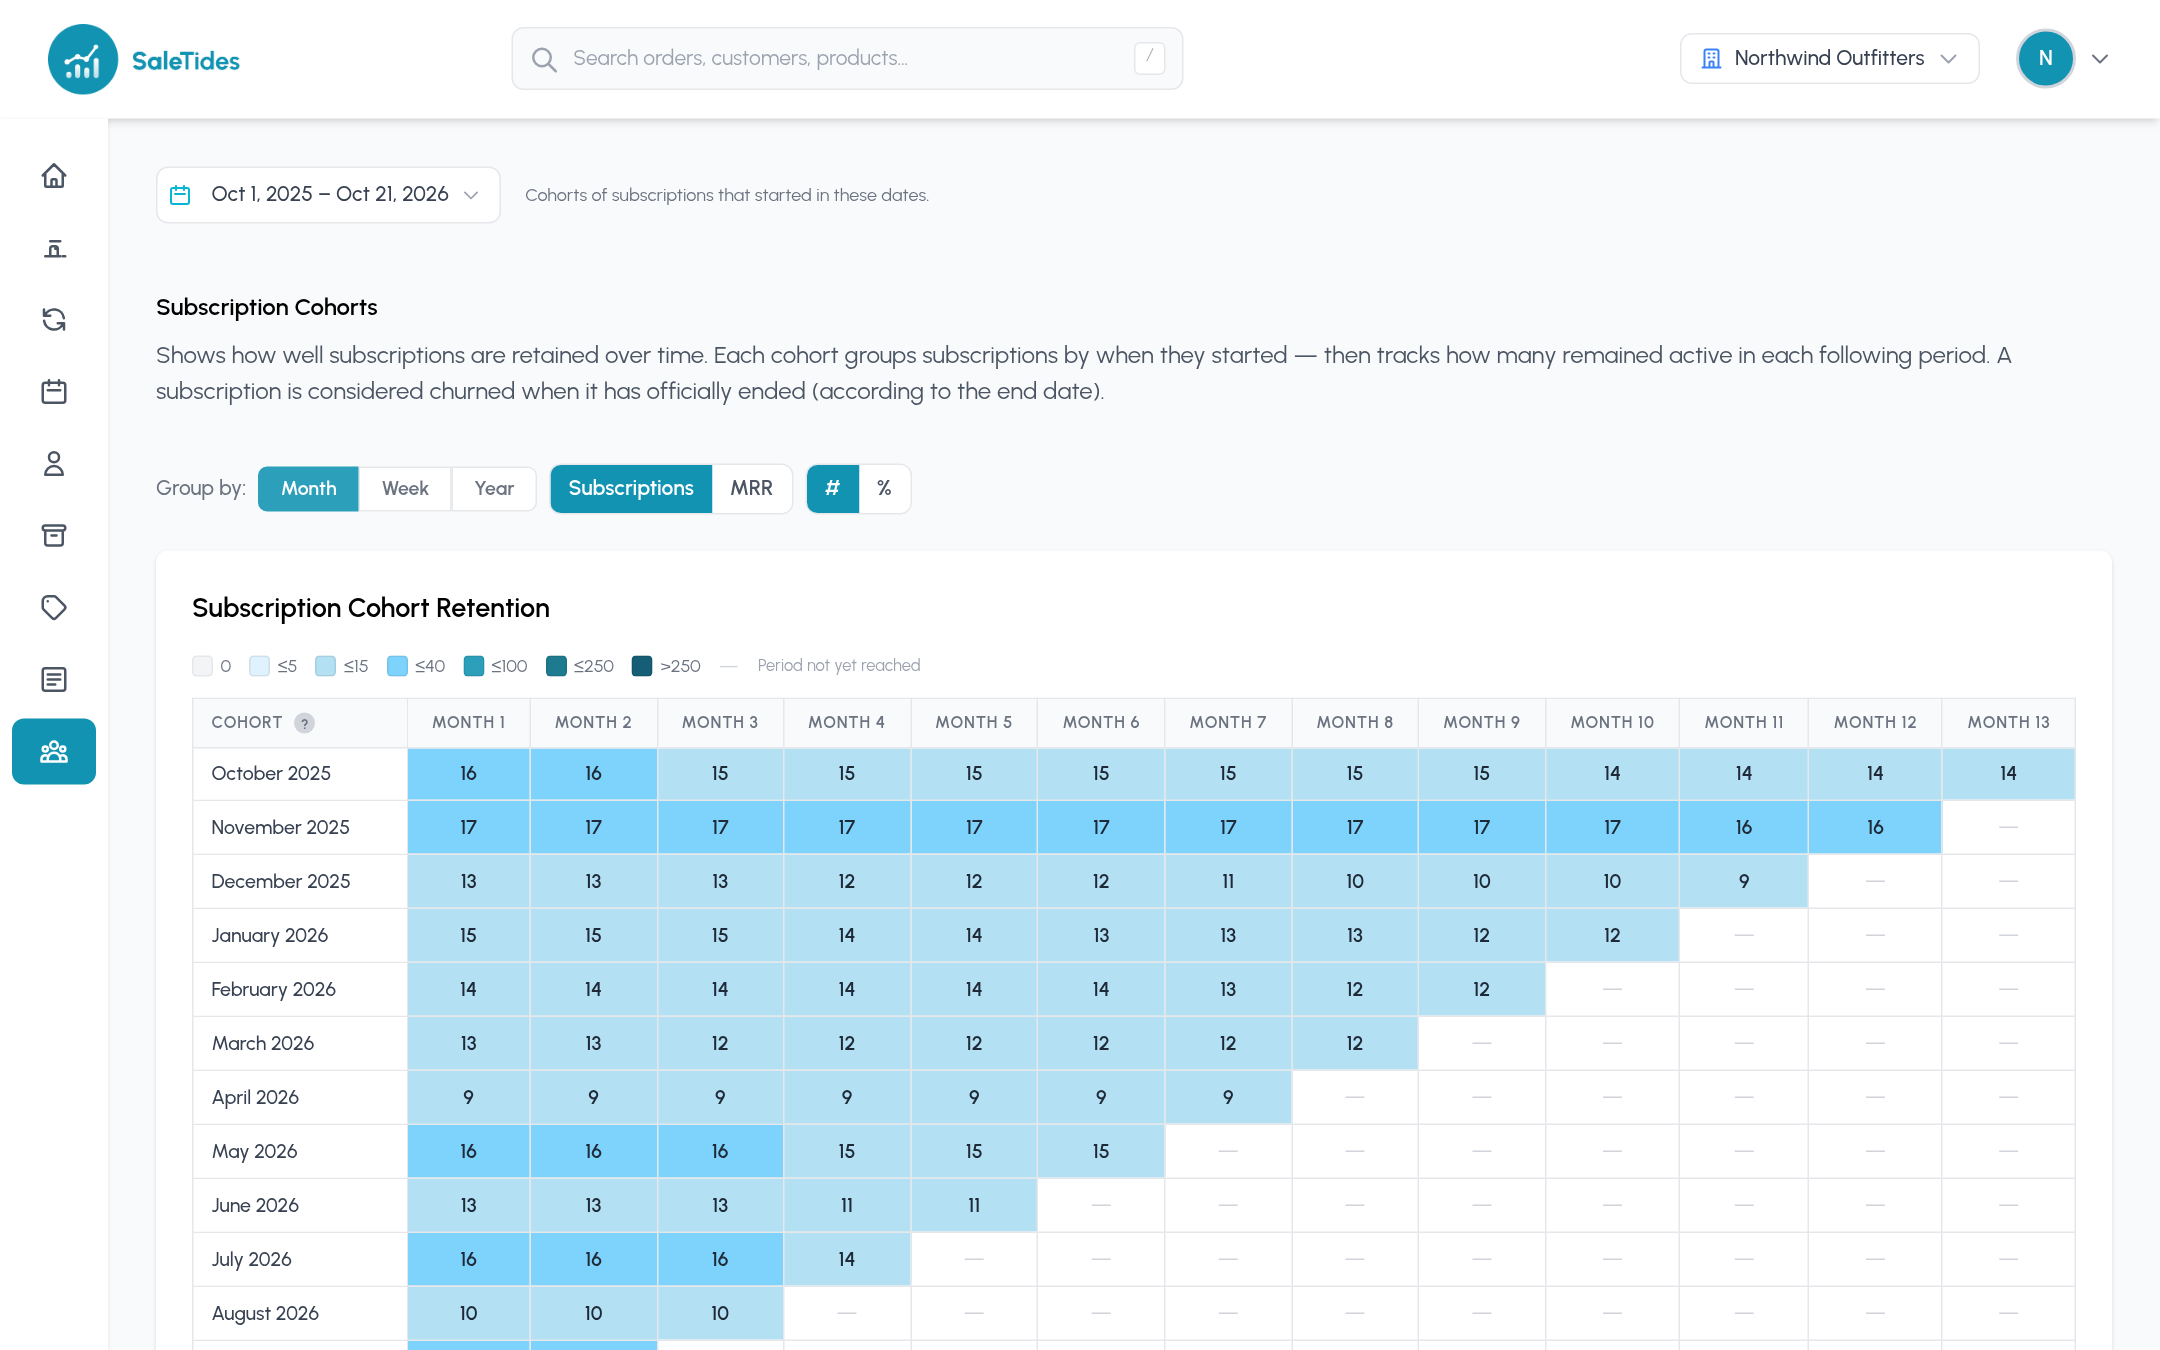
- Rows: a cohort, the subscriptions that started in that month (or week, or year).
- Month 1: what the cohort started with. Every later column is compared with it.
- Month 2, 3…: how many are still active one, two… periods after the cohort began. A subscription drops out once it has ended or been cancelled, so values only go down along a row.
- Subscriptions / MRR: count subscriptions, or add up the monthly recurring revenue of those still active.
- # / %: the numbers themselves, or the share of the cohort’s starting point still active.
- Average: each column averaged over the cohorts old enough to reach it. In % mode it’s the total still active divided by the total started, across those same cohorts.
- —: the cohort hasn’t reached that period yet.
Worked example
Worked example
20 subscriptions started in March. By the start of May (two months later), 3 had been cancelled.
Month 3 at 85% means 17 of March’s 20 subscriptions were still active two months after March began.
- The drop from Month 1 to Month 2. A sharp one usually means trial or first-payment churn: look at onboarding and the first renewal.
- Where a row levels off. After that point subscribers tend to stay, so getting customers past it matters most.
- A column read top to bottom. If newer cohorts keep a higher share at the same age, retention is improving.